

TikTok moves fast. One cat blink can become a trend. One sound can sell out a product. So, if you post on TikTok for a brand, creator account, or agency, you need numbers that make sense. That is where analytics dashboards come in.
TLDR: TikTok’s native analytics are free, simple, and great for quick checks. Third-party TikTok analytics dashboards give you deeper reports, better comparisons, and multi-account views. Native tools are best for beginners and small teams. Third-party tools are better when you need serious reporting, client updates, and smarter decisions.
What Is a Native TikTok Analytics Dashboard?
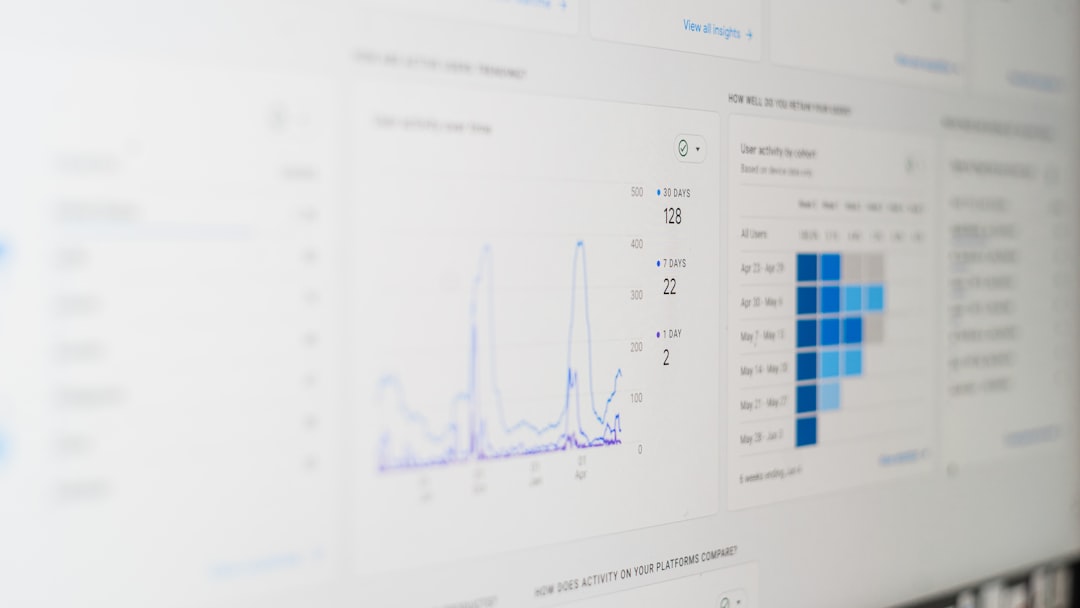
A native TikTok analytics dashboard is the analytics tool built into TikTok. You can find it inside TikTok if you have a Creator or Business account.
It shows basic performance data. You can see how your videos are doing. You can track followers. You can check views, likes, comments, and shares.
Think of it like the dashboard in a small car. It tells you your speed, fuel, and warning lights. Simple. Useful. Not fancy.
Native TikTok analytics usually include:
- Video views
- Profile views
- Likes, comments, and shares
- Follower growth
- Audience gender and location
- Watch time and retention
- Traffic sources
For many creators, this is enough. You can see what worked. You can spot weak posts. You can learn when your audience is active.
What Is a Third-Party TikTok Analytics Dashboard?
A third-party TikTok analytics dashboard is a separate tool made by another company. It connects to your TikTok account. Then it pulls your data into a new dashboard.
These tools often show more than TikTok’s native analytics. They may also connect to other platforms, like Instagram, YouTube, Facebook, LinkedIn, or X.
Think of it like upgrading from a bicycle bell to a full command center. You get more screens. More charts. More buttons. Maybe too many buttons, if you are not careful.
Third-party dashboards can help with:
- Advanced reporting
- Competitor tracking
- Hashtag analysis
- Multi-account management
- Team collaboration
- Client-ready reports
- Cross-platform comparisons
Key Difference 1: Depth of Data
TikTok’s native dashboard gives you the basics. That is not a bad thing. Basic data is easy to understand. It is also quick to check.
But third-party dashboards often go deeper. They may show trends over longer periods. They may let you compare many videos at once. They may help you find patterns that are hard to see inside TikTok.
For example, native analytics may show that a video got 50,000 views. Nice. A third-party dashboard might show that videos under 12 seconds using trending audio perform 40% better on your account. Even nicer.
Native is the “what happened.” Third-party is often the “why it happened.”
Key Difference 2: Reporting Power
This is a big one.
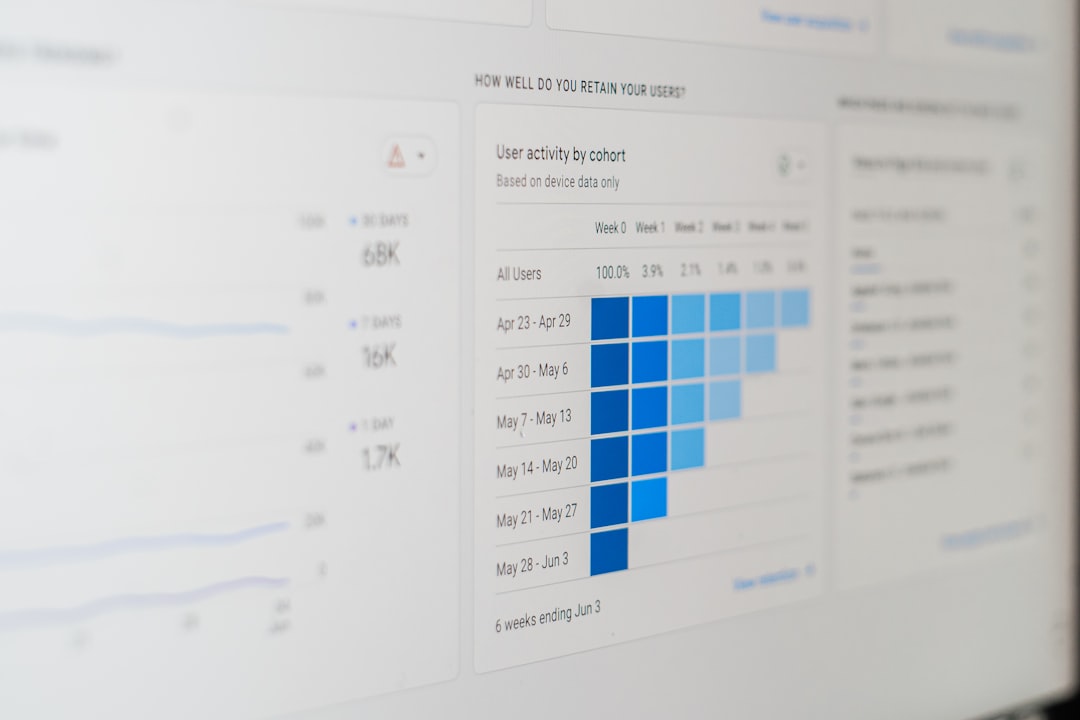
Native TikTok analytics are not built for polished reports. You can look at the numbers. You can take screenshots. You can copy data by hand. But that gets old fast.
Third-party dashboards are usually better for reporting. Many let you build custom reports. Some send reports automatically. Some even let you add your logo, notes, and charts.
This matters if you report to:
- Clients
- Managers
- Marketing teams
- Brand partners
- Influencer campaign stakeholders
Instead of saying, “Trust me, the vibes are good,” you can show a clean report. The vibes now have pie charts.
Key Difference 3: Ease of Use
TikTok’s native analytics win on simplicity. Everything is already inside the app. You do not need to connect anything. You do not need to learn a new system.
If you are a solo creator, that is great. You can check your numbers between coffee and filming your next video.
Third-party tools can take more time to set up. Some have many features. That can be amazing. It can also feel like opening a spaceship control panel.
So the easier option depends on your needs:
- Need quick answers? Native is easier.
- Need deep analysis? Third-party is stronger.
- Need client reports? Third-party is usually better.
Key Difference 4: Account Management
If you manage one TikTok account, native analytics may be enough.
But what if you manage five accounts? Or twenty? Or a whole galaxy of brand pages?
That is where third-party dashboards shine. They often let you view many accounts in one place. You can compare performance. You can see which brand is growing fastest. You can spot which accounts need help.
This is especially useful for agencies, social media managers, and large marketing teams.
Native TikTok analytics work account by account. Third-party dashboards can bring everything together.
Key Difference 5: Competitor and Trend Tracking
TikTok’s native analytics mostly focus on your own account. That makes sense. TikTok shows your data.
Third-party tools may also track competitors, creators, hashtags, sounds, and trends. This can be powerful.
You might learn that a competitor posts more often. Or that their funny product demos get more comments. Or that a hashtag you ignored is suddenly taking off.
Of course, not all third-party tools offer the same features. Some are simple. Some are very advanced. Always check what is included before you pay.
Key Difference 6: Data History
Native TikTok analytics may limit how far back you can look. This can make long-term analysis harder.
Third-party dashboards often store more historical data after you connect your account. This helps you track growth over months or years.
Long-term data is useful because TikTok can be unpredictable. One viral post can make your whole month look wild. A longer view helps you see the real story.
It helps answer questions like:
- Are we growing steadily?
- Which content themes work best over time?
- Did our campaign actually improve engagement?
- Are followers turning into website visitors or buyers?
Key Difference 7: Custom Metrics
Native analytics show standard TikTok metrics. These are helpful. But every team has different goals.
A beauty brand may care about saves and product clicks. A musician may care about sound usage. An agency may care about cost per engagement. A creator may care about watch time and follower growth.
Third-party dashboards often let you create custom views. You can focus on the metrics that matter most to you.
This means less noise. More signal. Fewer “what am I even looking at?” moments.
Best Features of Native TikTok Analytics
Native TikTok analytics are not weak. They are just focused. They are great for quick learning.
Best native features include:
- Free access: No extra cost.
- Easy setup: It is already in TikTok.
- Post performance: See views, likes, comments, shares, and retention.
- Follower insights: Learn who follows you and when they are active.
- Fast checks: Great for daily content decisions.
If you are starting out, use TikTok’s own analytics first. Learn the basics. Watch your audience. See what makes people stop scrolling.
Best Features of Third-Party TikTok Analytics
Third-party dashboards are built for people who need more control.
Best third-party features often include:
- Custom dashboards: Choose the metrics you want to see.
- Automated reports: Save time every week or month.
- Multi-platform data: Compare TikTok with other social channels.
- Competitor insights: See how others perform.
- Campaign tracking: Measure influencer or paid campaigns.
- Team access: Let different people view or manage reports.
These features can turn messy data into a clear story. And clear stories help teams make better choices.
Which One Should You Choose?
Choose native TikTok analytics if you are a creator, small business, or beginner. It is free. It is simple. It gives you the main numbers you need.
Choose a third-party TikTok analytics dashboard if you manage many accounts, run campaigns, or report to other people. It is also better if you need competitor tracking, custom reports, or deeper insights.
Here is the simple version:
- Solo creator? Start with native.
- Small brand? Native may be enough at first.
- Agency? Use third-party tools.
- Enterprise team? Third-party is usually the smarter choice.
- Reporting to clients? Third-party will save your sanity.
Final Thoughts
TikTok analytics do not need to feel scary. They are just clues. Each view, like, share, and comment tells you something.
Native TikTok analytics give you a clean starting point. They help you understand your content without extra tools. Third-party dashboards take things further. They help you report better, compare faster, and plan smarter.
The best choice depends on your goals. If you only need quick insights, stay native. If you need deeper reporting and bigger-picture strategy, go third-party.
Either way, do not just collect numbers. Use them. Test new ideas. Drop what does not work. Do more of what makes people watch, smile, comment, and share.
That is the real magic. Not the dashboard. The decisions you make after reading it.