
Pick Datadog if you want one giant cockpit, New Relic if you want fast app insight, and Grafana Cloud if your team already loves dashboards. BetterStack is friendly and clean, but it is not always enough when alerts, traces, logs, uptime checks, and on-call pain all pile up. Outages hurt too. Uptime Institute reported that 54% of major outages cost more than $100,000 [source: Uptime Institute].
TLDR: The best BetterStack alternatives are Datadog, New Relic, Grafana Cloud, Sentry, PagerDuty, Jira Service Management, and Splunk Observability Cloud. If your checkout fails for 5 minutes during a sale, and you process 2,000 requests per minute, you need alerts that scream fast and logs that make sense. Small teams may prefer New Relic or Grafana Cloud. Larger teams may pick Datadog or Splunk.
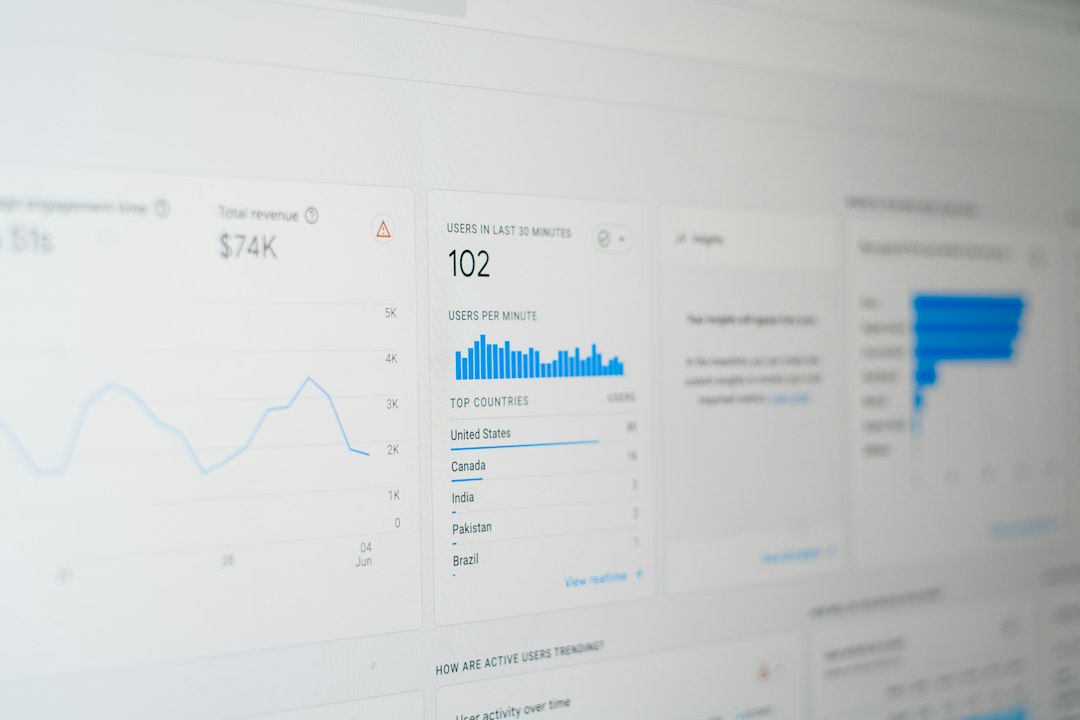
1. Datadog
Best for: teams that want almost everything in one place.
Datadog watches apps, servers, logs, containers, databases, cloud services, and user sessions. It is like a security guard, mechanic, and traffic cop in one chair.
Why it is better than BetterStack: it goes much deeper into infrastructure. You get rich APM, real user monitoring, synthetic tests, log search, and network views.
The annoying bit: pricing can feel like opening a mystery box. One extra data stream can make finance ask questions. Expect billing checks to become a monthly ritual.
- Great for: Kubernetes, AWS, Azure, GCP, microservices.
- Not ideal for: tiny teams that only need uptime checks.
- Fun rating: 8/10, if charts make you happy.
2. New Relic
Best for: application monitoring without too much drama.
New Relic is strong at APM. It helps you find slow pages, broken transactions, bad database calls, and weird errors. It is a smart pick for product teams that care about user speed.
Why it is better than BetterStack: it explains app performance in a clean way. Developers can jump from a slow request to traces, logs, and errors fast.
The catch is… some menus feel like they moved while you were making coffee. It is still powerful, but new users may need a few days to settle in.
- Great for: SaaS apps, APIs, mobile backends.
- Not ideal for: teams that only need incident status pages.
- Fun rating: 7/10, very useful, not flashy.
3. Grafana Cloud
Best for: teams that love open source tools.
Grafana Cloud brings together metrics, logs, traces, dashboards, and alerts. It uses tools many engineers already know, like Prometheus, Loki, and Tempo.
Why it is better than BetterStack: dashboards are the star. You can build clean, sharp views for uptime, latency, CPU, memory, queues, and error rates.
Honestly, it feels like Grafana gives you a giant box of LEGO. Great if you like building. Less great if you wanted a finished toy.
- Great for: DevOps teams, platform teams, open source fans.
- Not ideal for: teams that hate setup work.
- Fun rating: 9/10, if you enjoy dashboard art.
For more ideas on infrastructure reliability, it helps to think in layers: alerts, logs, metrics, incidents, and user impact.
4. Sentry
Best for: finding app errors before users send angry emails.
Sentry is not a full BetterStack clone. It focuses on errors, crashes, performance, and code-level detail. Developers love it because it points to the broken line of code.
Why it is better than BetterStack: it is sharper for bug tracking. You can see stack traces, affected users, release versions, and repeat issues.
- Great for: frontend apps, mobile apps, backend services.
- Not ideal for: full infrastructure monitoring.
- Fun rating: 8/10, because bugs have nowhere to hide.
5. PagerDuty
Best for: incident response and on-call teams.
PagerDuty is built for alerts, rotations, escalation rules, and incident work. When something breaks at 2:13 a.m., PagerDuty makes sure the right human gets poked.
Why it is better than BetterStack: incident management is deeper. You get schedules, policies, service ownership, noise control, and post-incident workflows.
The small pain: noisy alerts can still ruin your evening if your rules are messy. PagerDuty is powerful, but it will not fix lazy alert design.
- Great for: SRE teams, support teams, 24/7 operations.
- Not ideal for: teams wanting built-in log monitoring first.
- Fun rating: 6/10, useful but loud.
6. Jira Service Management
Best for: teams already using Jira.
Jira Service Management handles incidents, requests, changes, assets, and support queues. It connects well with engineering work in Jira Software.
Why it is better than BetterStack: it is strong for process. If your company needs approvals, tickets, service desks, and audit trails, it fits well.
- Great for: IT teams, enterprise support, internal service desks.
- Not ideal for: deep app performance tracing.
- Fun rating: 5/10, but managers may clap.
7. Splunk Observability Cloud
Best for: large systems with lots of data.
Splunk Observability Cloud covers metrics, traces, logs, synthetic checks, and infrastructure views. It is made for teams that need serious search and scale.
Why it is better than BetterStack: it handles big data well. It is strong when you have many services, many teams, and many things breaking in strange ways.
- Great for: enterprises, complex apps, high-volume logging.
- Not ideal for: small teams on tight budgets.
- Fun rating: 7/10, powerful but heavy.
Quick Pick Guide
- Choose Datadog if you want broad monitoring in one tool.
- Choose New Relic if app speed is your main worry.
- Choose Grafana Cloud if dashboards make your team smile.
- Choose Sentry if bugs are slipping into production.
- Choose PagerDuty if on-call chaos is the real problem.
- Choose Jira Service Management if tickets and process matter.
- Choose Splunk if your data volume is huge.
Final tip: do not buy the biggest tool because it looks impressive. Buy the one that cuts your alert time, explains failures clearly, and helps your team fix problems faster. Fewer mystery alerts. Fewer panic tabs. More sleep.